Find better Airbnb markets. Buy better STR deals.
STRProfitMap helps you find high-potential markets, analyze any property, and verify regulations before you commit capital.
✓ Reliable listings only · ✓ 20,000+ US markets · ✓ Property analyzer

Your Competitors Use the Same Data. Yours Should Be Better.
Most Airbnb data tools analyze every listing: abandoned properties, seasonal hobbyists, listings with two reviews. Then they call it “market data.” You make a $100K+ decision on it.
STRProfitMap takes a different approach. We filter down to reliable listings only, properties with proven track records, consistent bookings, and real revenue history. The noise is gone before you ever see a number.
The result: data you can actually underwrite with confidence.
Full Product Suite
Every tool you need from first search to closing day.
Research markets, underwrite properties, check regulations, and build your deal pipeline. One platform, no spreadsheet gymnastics.
Know if the deal works before you write the check.
Paste an address. Get revenue projections, cap rate, cash-on-cash, DSCR, expense breakdowns, and nearby comps in under two minutes.
The Property Analyzer pulls weighted comparables from nearby reliable listings and runs full financial modeling: four revenue scenarios (conservative to top performer), automated expense calculations, and multi-year investment projections. Every number is backed by real rental data, not industry averages from a blog post.
- Get four revenue bands (P25, P50, P75, P90) so you underwrite to the downside, not the dream.
- See NOI, cap rate, cash-on-cash, and DSCR color-coded green, yellow, or red for instant viability.
- Remove outlier comps that skew the numbers, and watch projections recalculate in real time.
The difference between a six-figure win and a six-figure lesson is in the underwriting.
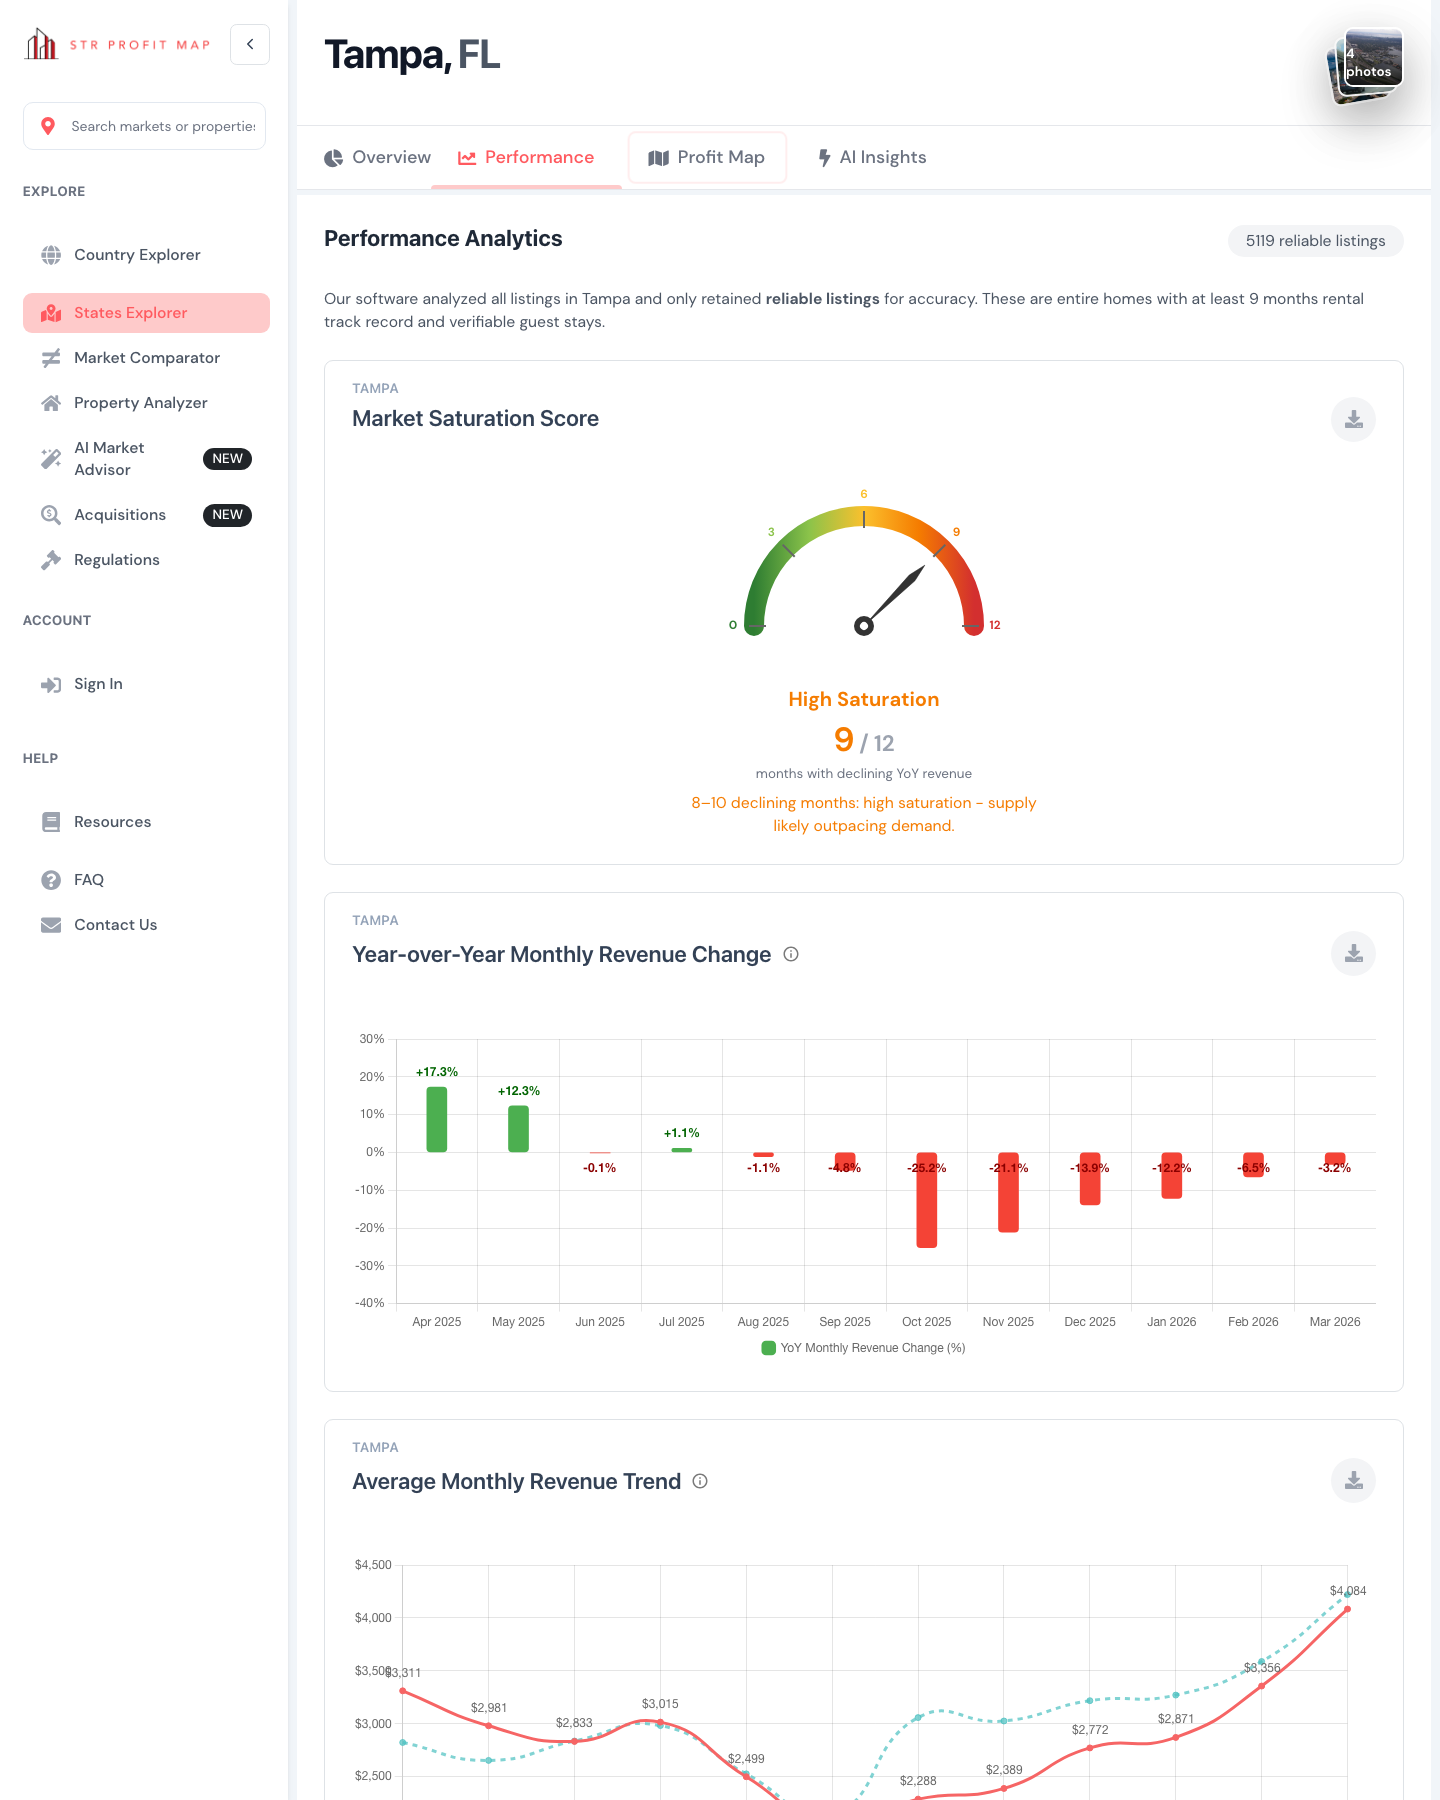
See what a market actually does before you trust someone else's opinion.
Revenue trends, occupancy shifts, ADR patterns, supply growth, and a proprietary saturation score across 5,588 cities.
Market Analytics gives you the full operating picture: 9 performance charts covering monthly revenue, occupancy, and ADR trends against prior year, supply growth trajectories, revenue distribution by bedroom count, and performance tier breakdowns comparing what top, middle, and bottom earners actually generate. Plus a Market Saturation Score (0 to 12) that flags when a market is approaching oversupply, so you see the risk before you are in it.
- Spot declining markets early with year-over-year revenue change charts and the saturation gauge.
- Find the bedroom count that dominates top earners in any city, not the one your agent recommends.
- Compare what the top 25% of properties earn versus the middle and bottom, market by market.
The investors who pick winning markets are the ones reading the trend, not the headline.
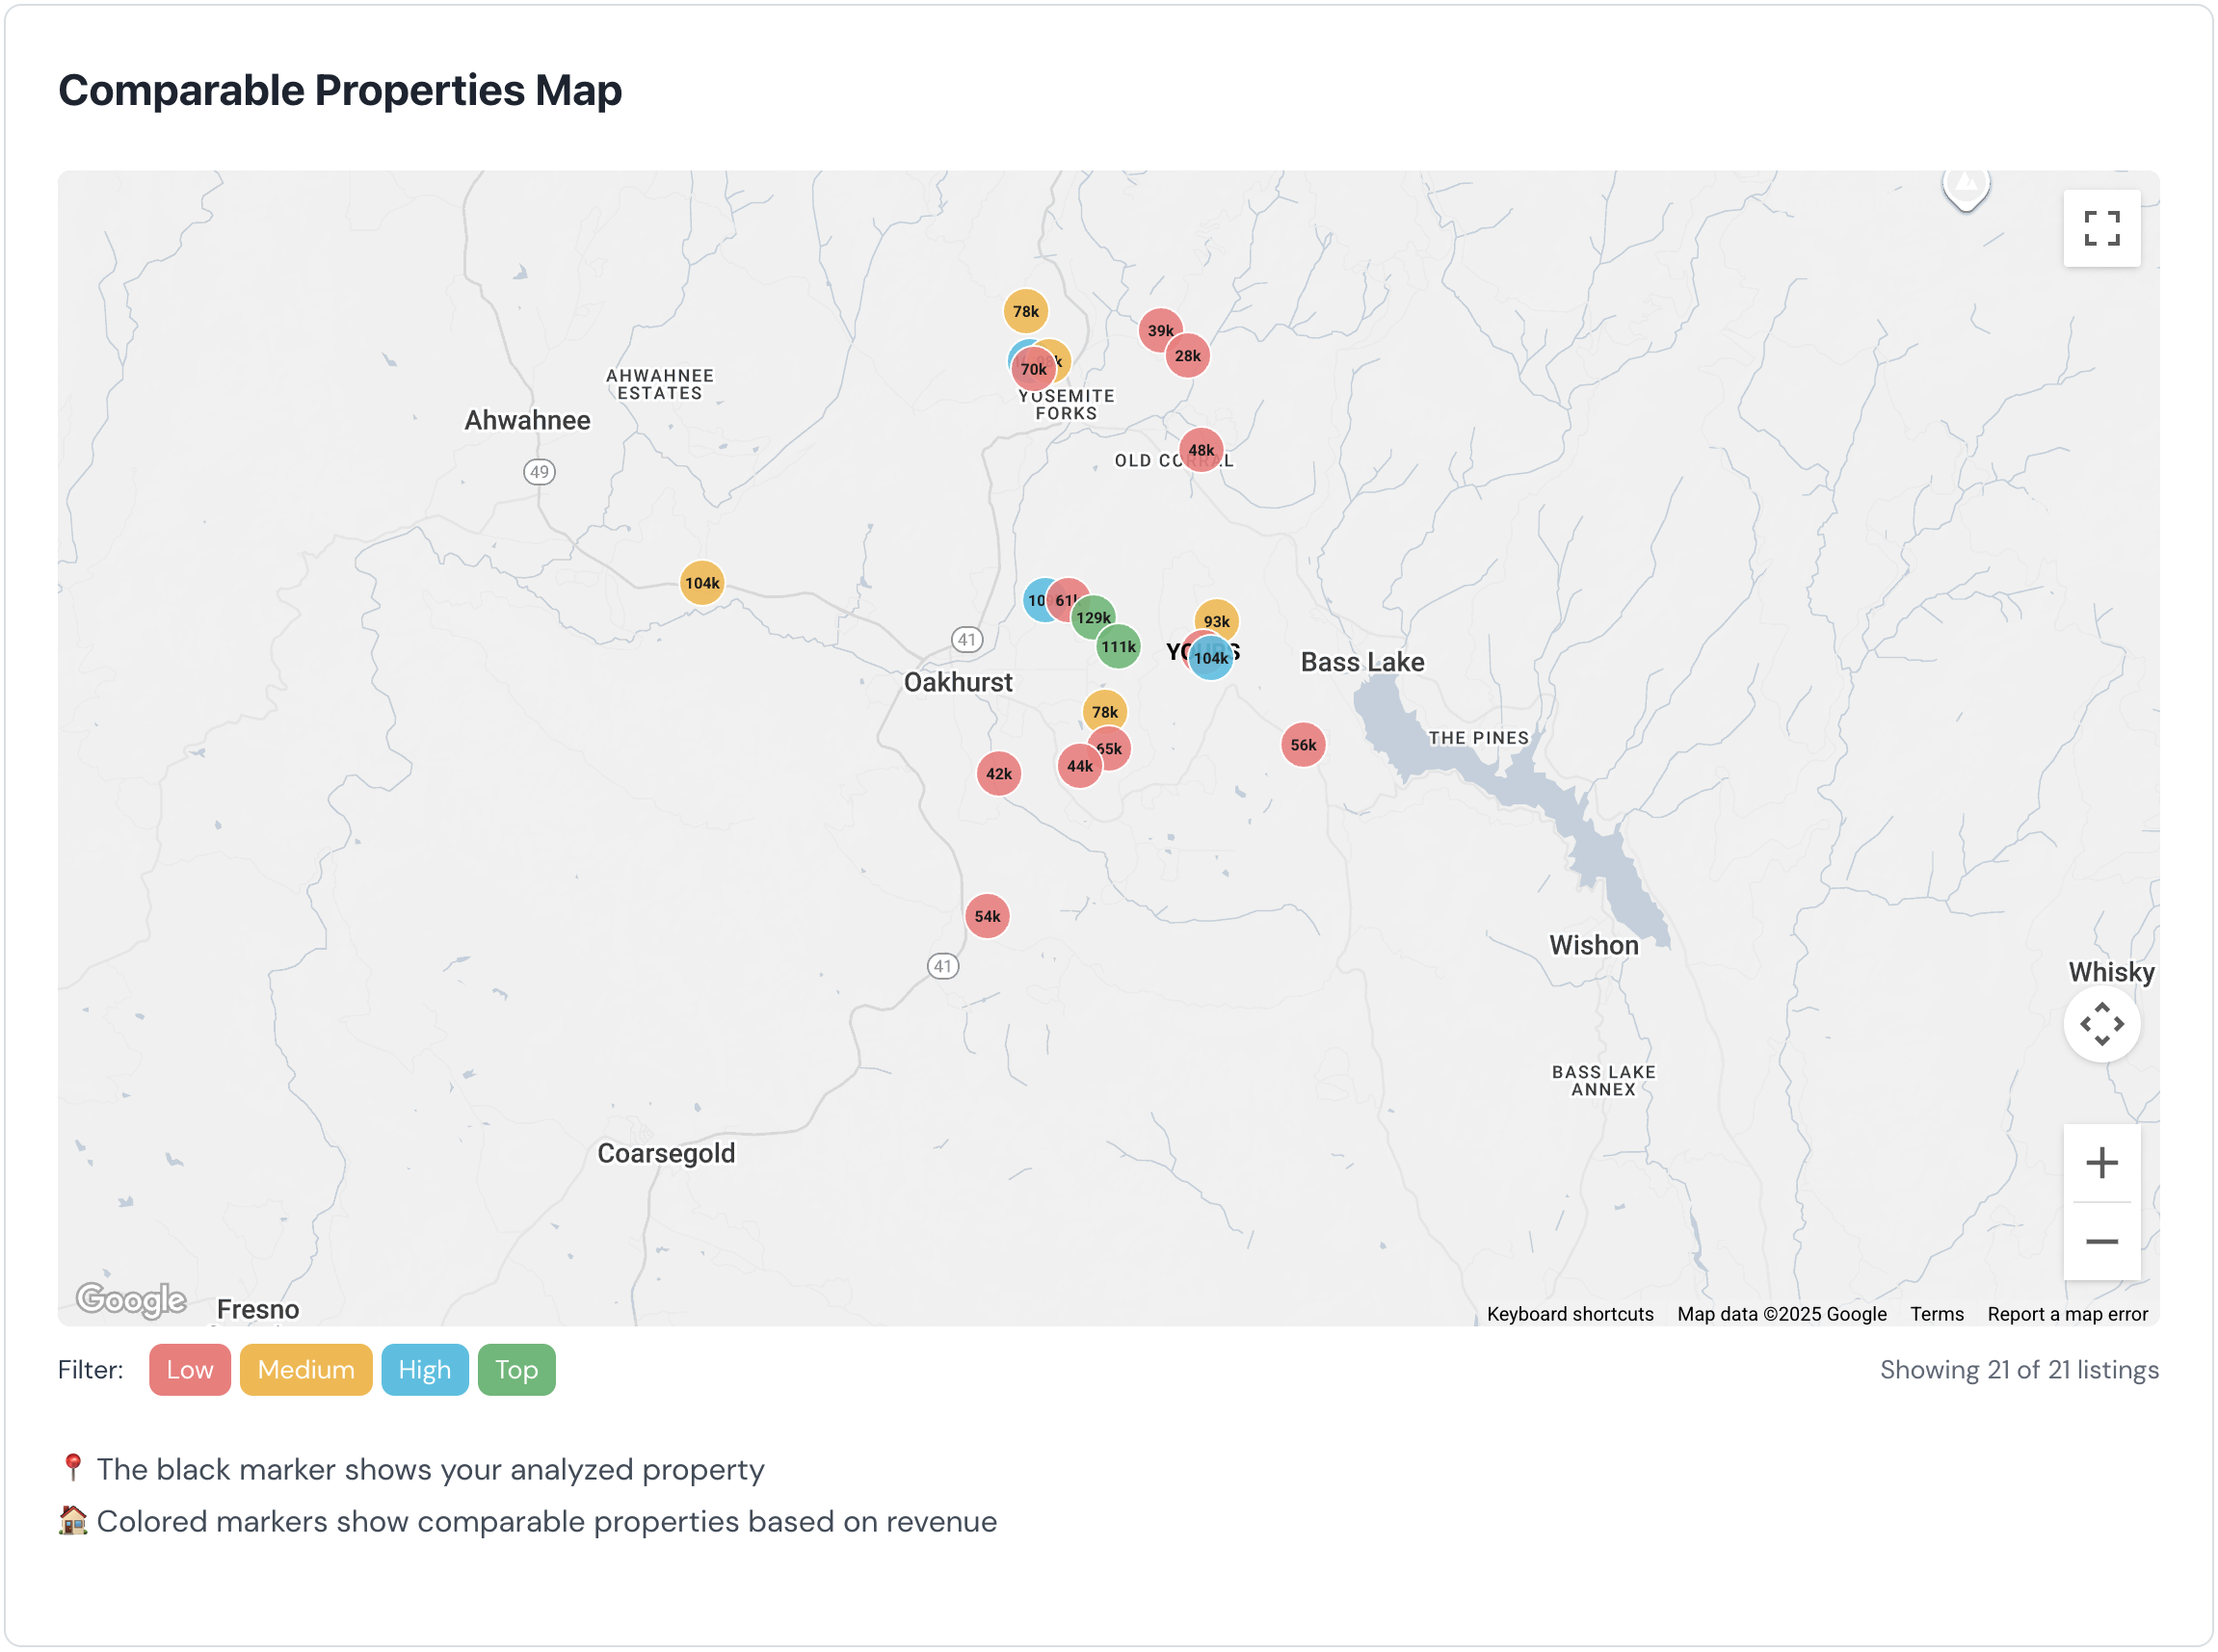
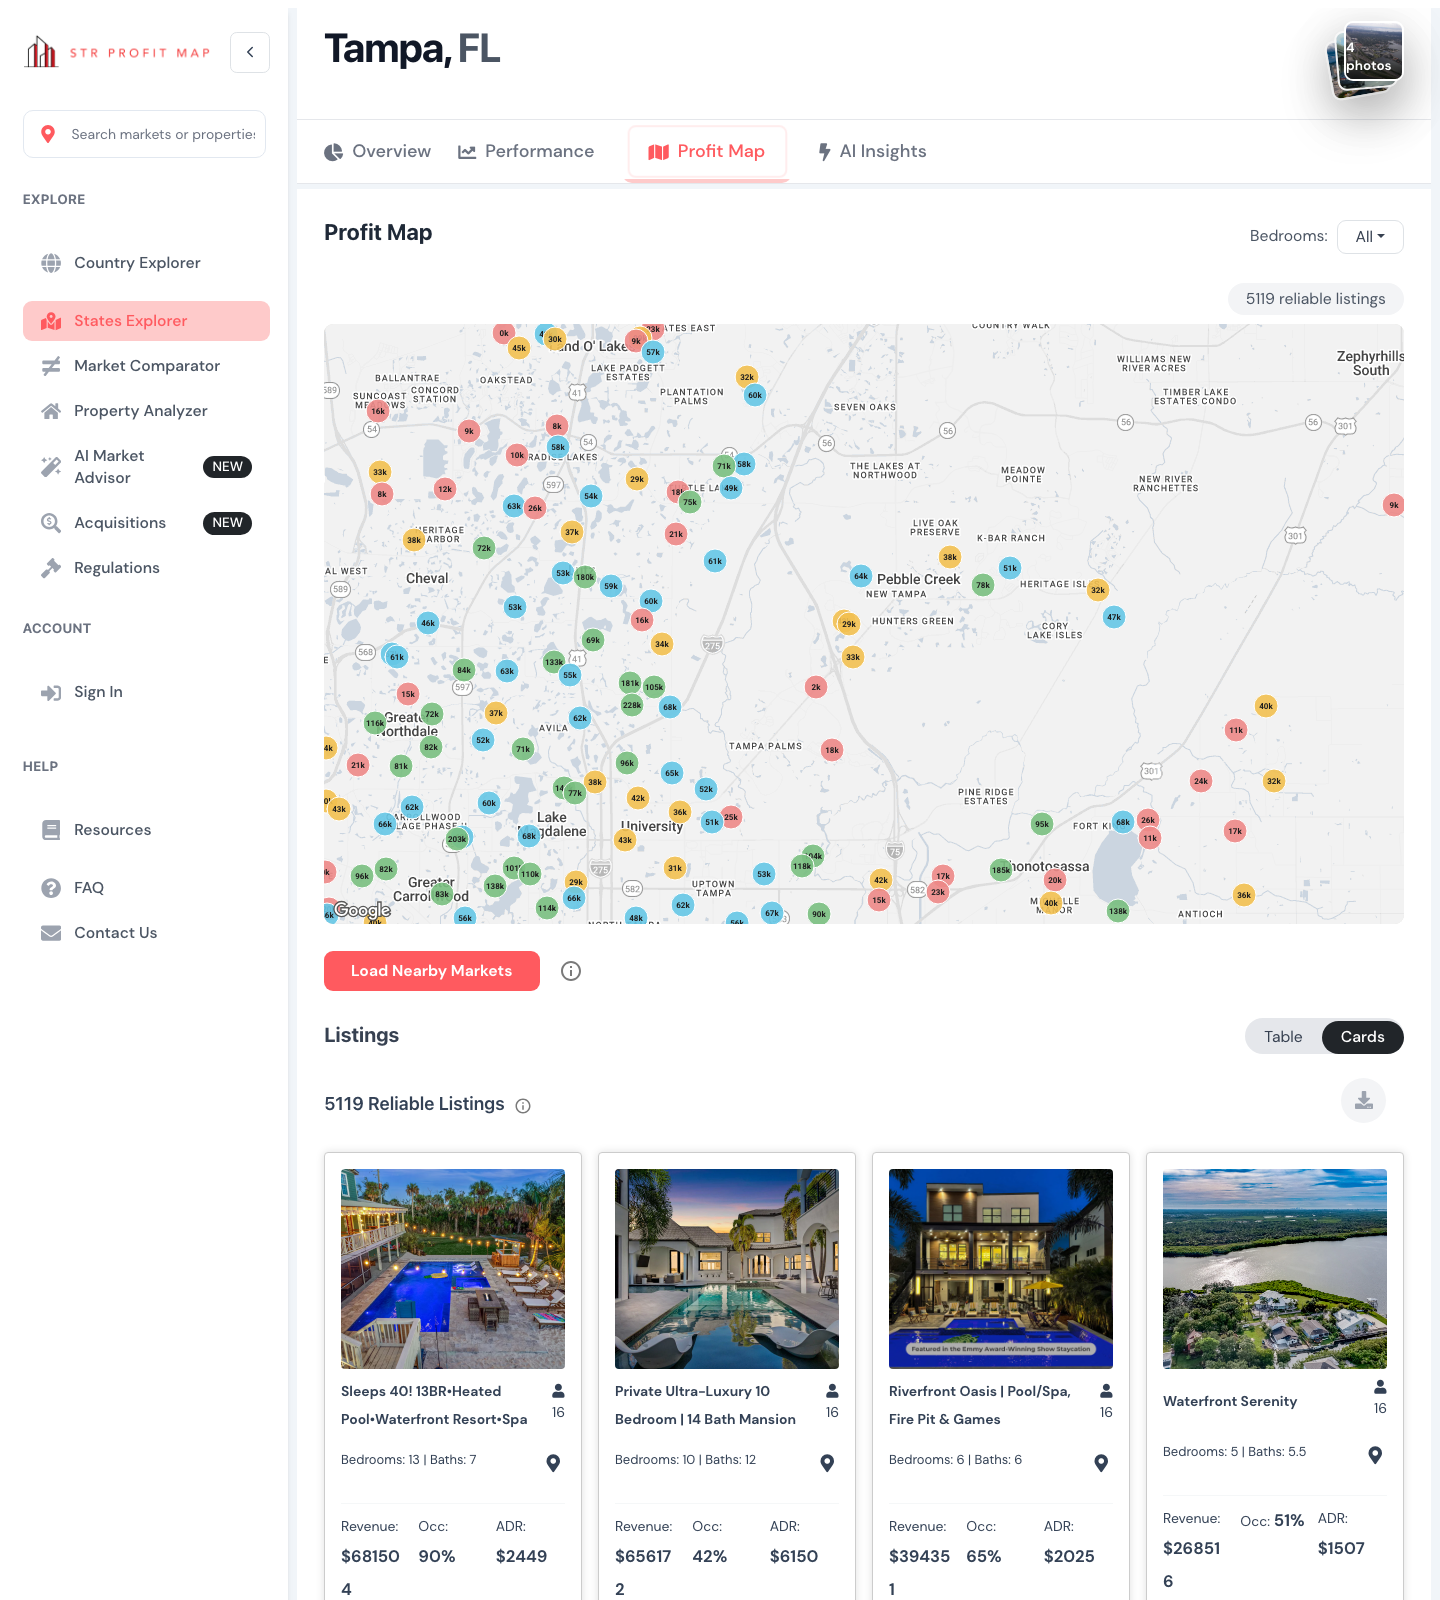
Find the right neighborhood, not just the right city.
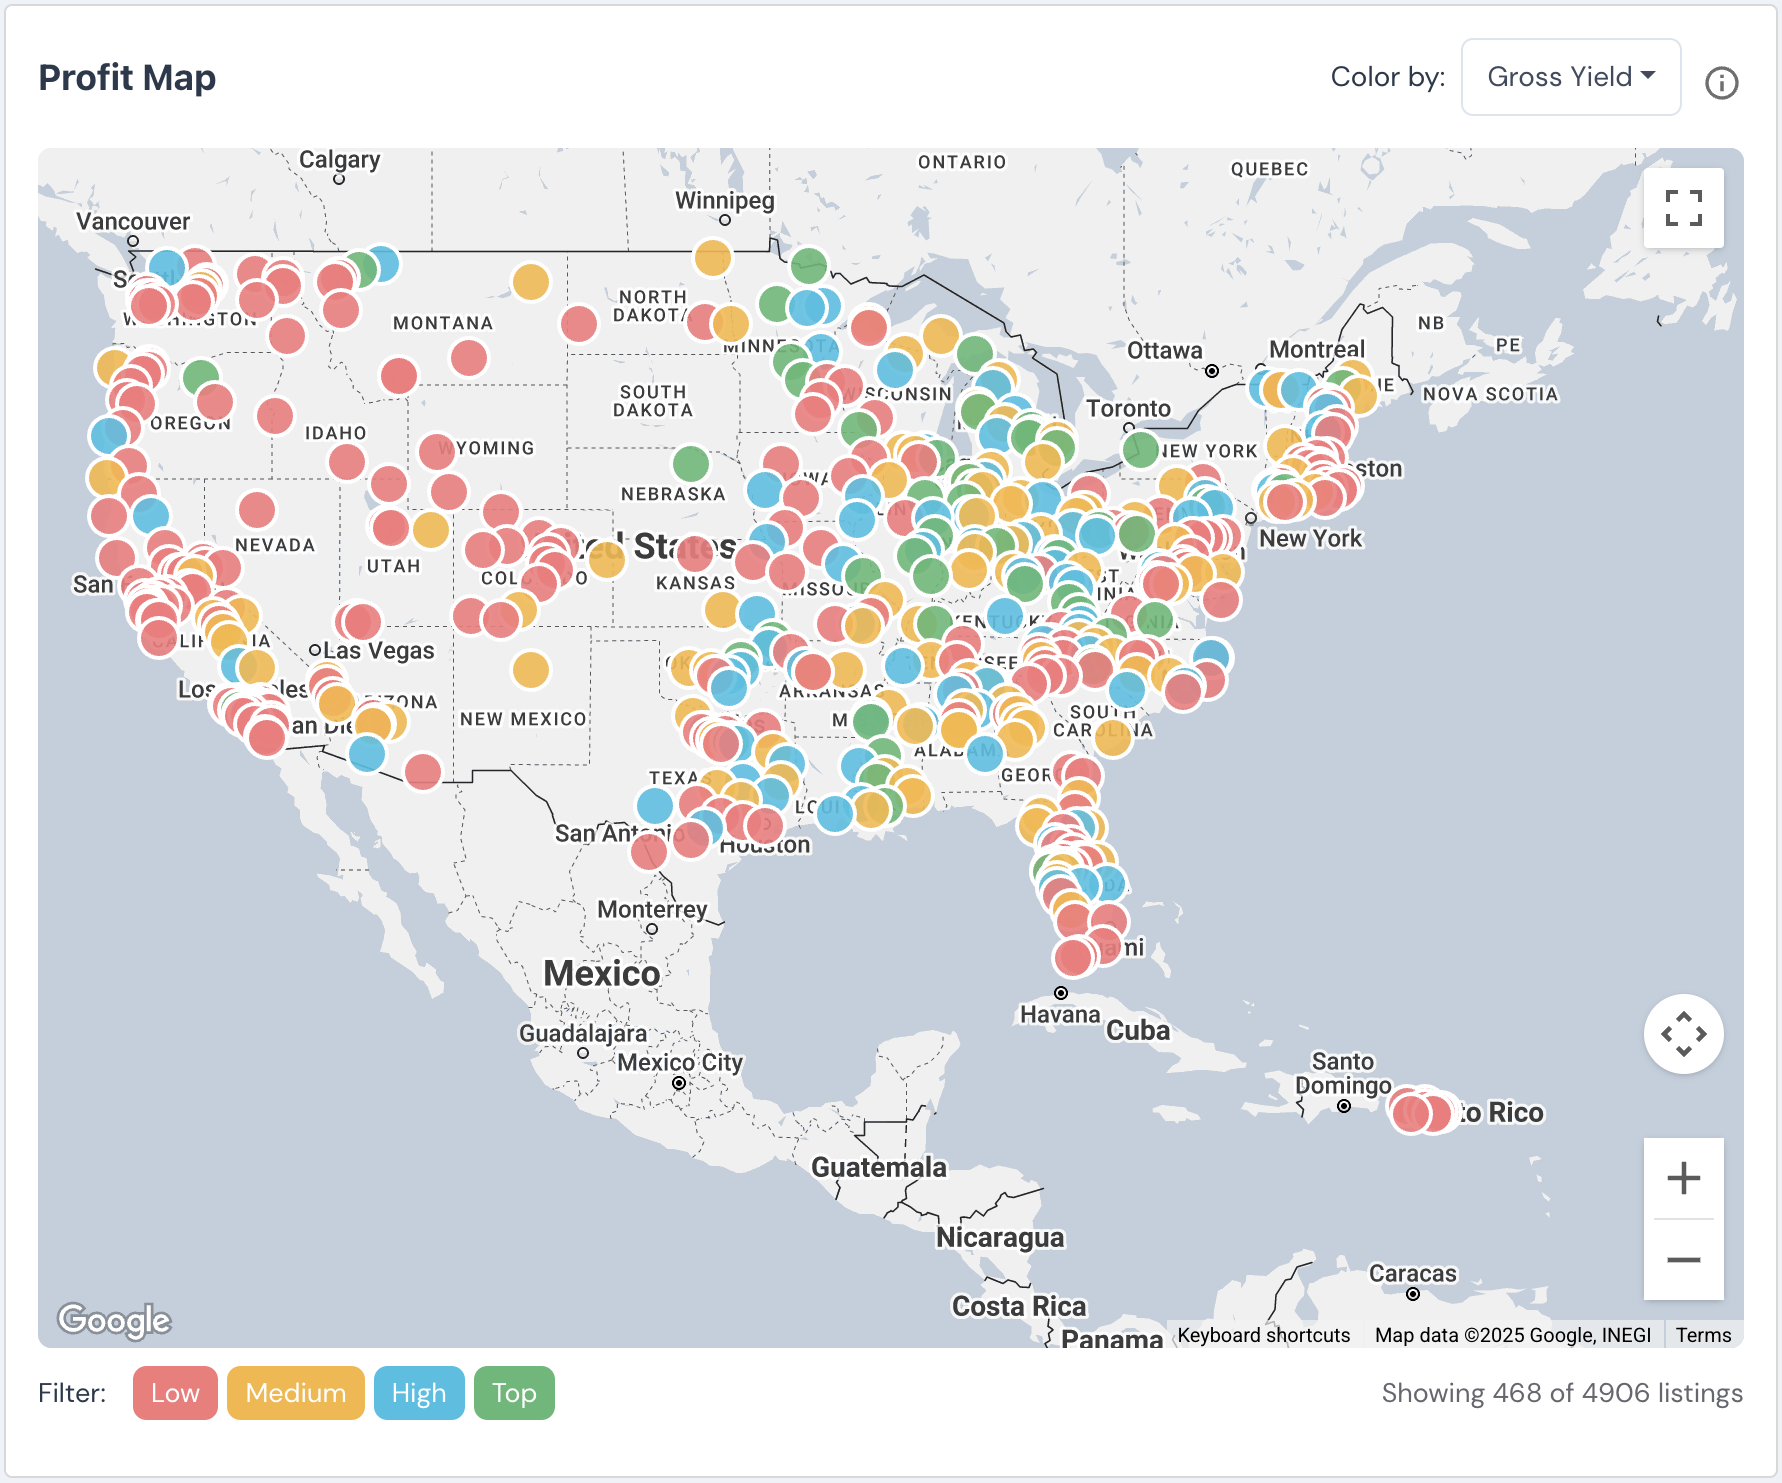
Interactive maps color-coded by revenue tier show you exactly where top-performing STRs cluster inside any market.
Profit Maps plot every reliable listing on a Google Maps overlay, color-coded by revenue performance: low, medium, high, and top tier. Filter by bedroom count. Click any pin for individual listing data. Load nearby markets to expand your search radius. This is how you go from "I like this city" to "I want to buy on this street."
- See exactly which micro-neighborhoods produce the highest revenue per listing.
- Filter by bedroom count and revenue tier to match your investment criteria.
- Stop relying on zip code averages when the block-by-block reality tells a different story.
Location drives returns. The map shows you where the returns actually are.
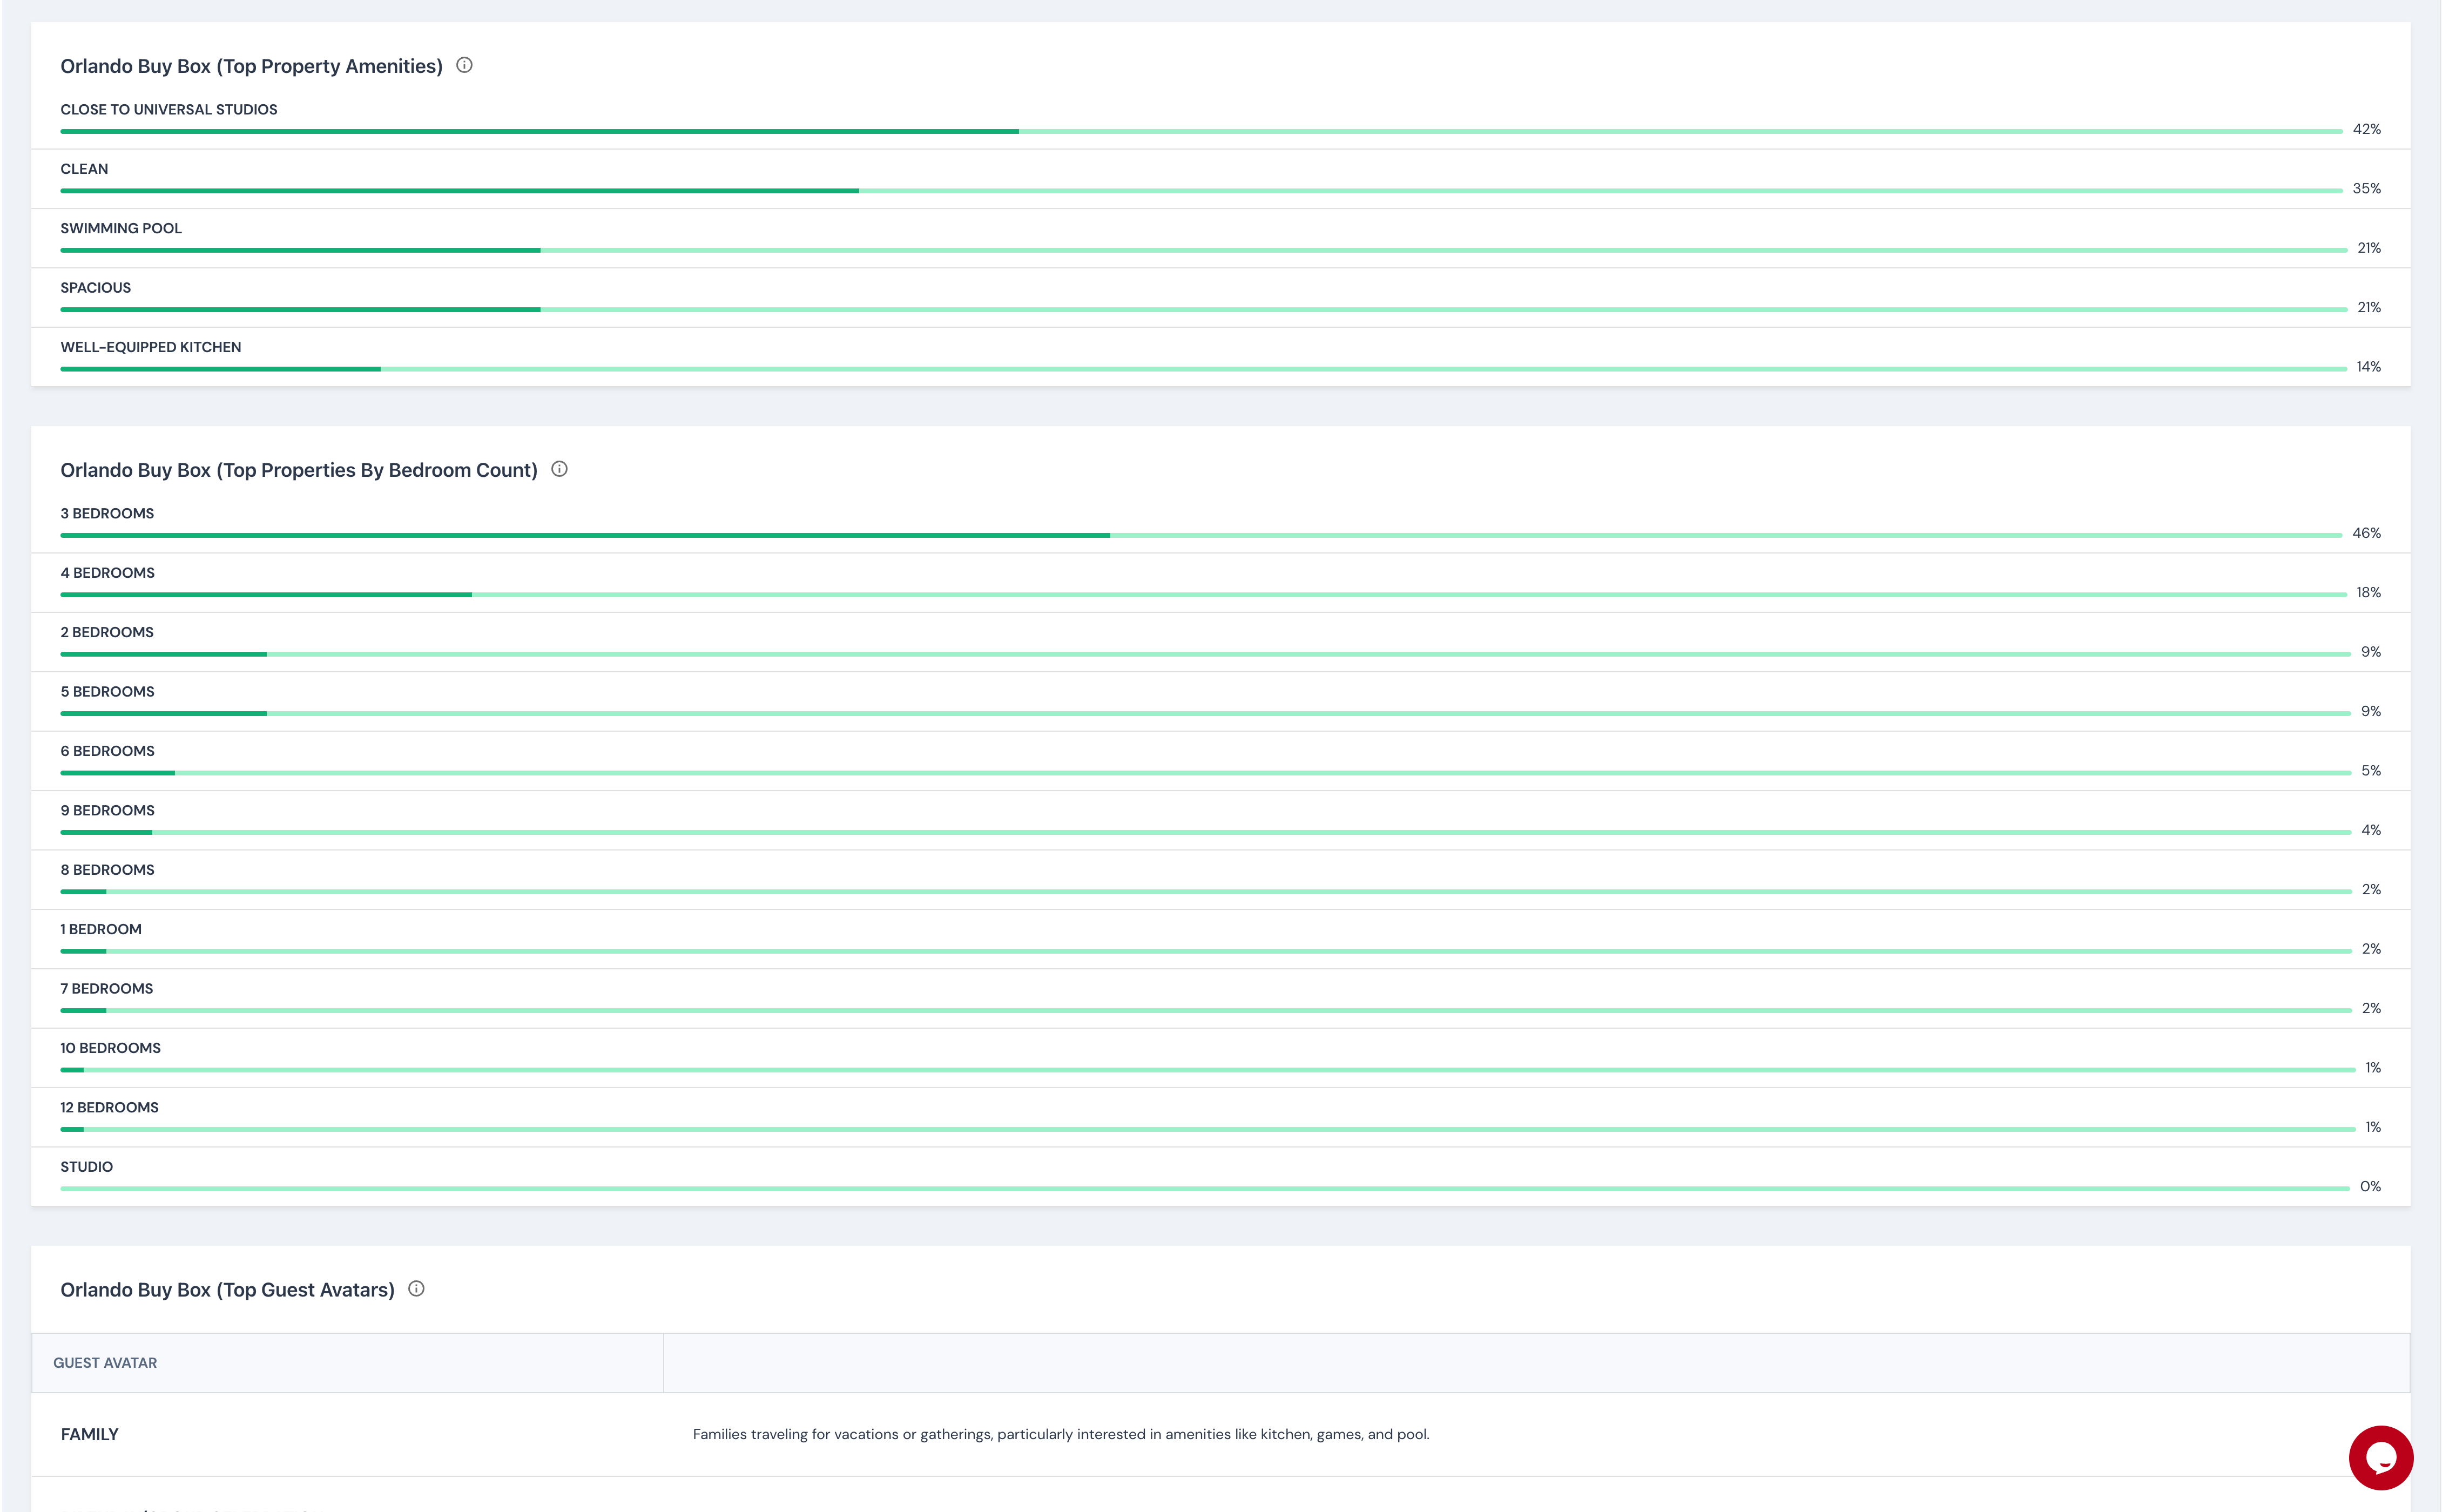
Stop evaluating every listing from scratch.
Define your target price range, return threshold, market, and property type once. Let matching deals come to you.
Buy Boxes let you codify your investment thesis into clear, repeatable criteria: target markets, minimum cap rate, revenue floor, bedroom count, home price ceiling. When new listings hit the platform, your buy box filters them automatically so you spend time on deals that fit, not deals that feel interesting but fail the math.
- Set rules once and get matched listings surfaced without manual searching.
- Run multiple buy boxes for different strategies (cash flow vs. appreciation, mountain vs. beach).
- Move from "I need to find deals" to "deals that match my criteria are already here."
Coming soon. Scaling a portfolio means scaling your sourcing. Buy Boxes are how.
Compare all US markets in minutes instead of months.
Browse every US STR market from one screen. Sort by cap rate, revenue, occupancy, or home value. Build your shortlist before you go deep.
Country Explorer gives you card and table views of 5500+ US markets (covering 20000+ cities) with six KPIs per market: listing count, cap rate, median revenue, occupancy, average home value, and ADR. Filter by state, sort by any metric, and use the interactive profit map to spot high-yield clusters visually. Go from 5,588 options to a shortlist of 5 in one session.
- Sort by cap rate to find high-yield markets, or by revenue to find high-ceiling ones.
- Filter by state and listing count to match your experience level and risk appetite.
- Use the national profit map to spot profitable clusters you would never find in a Google search.
The best investors screen wide before they commit narrow.
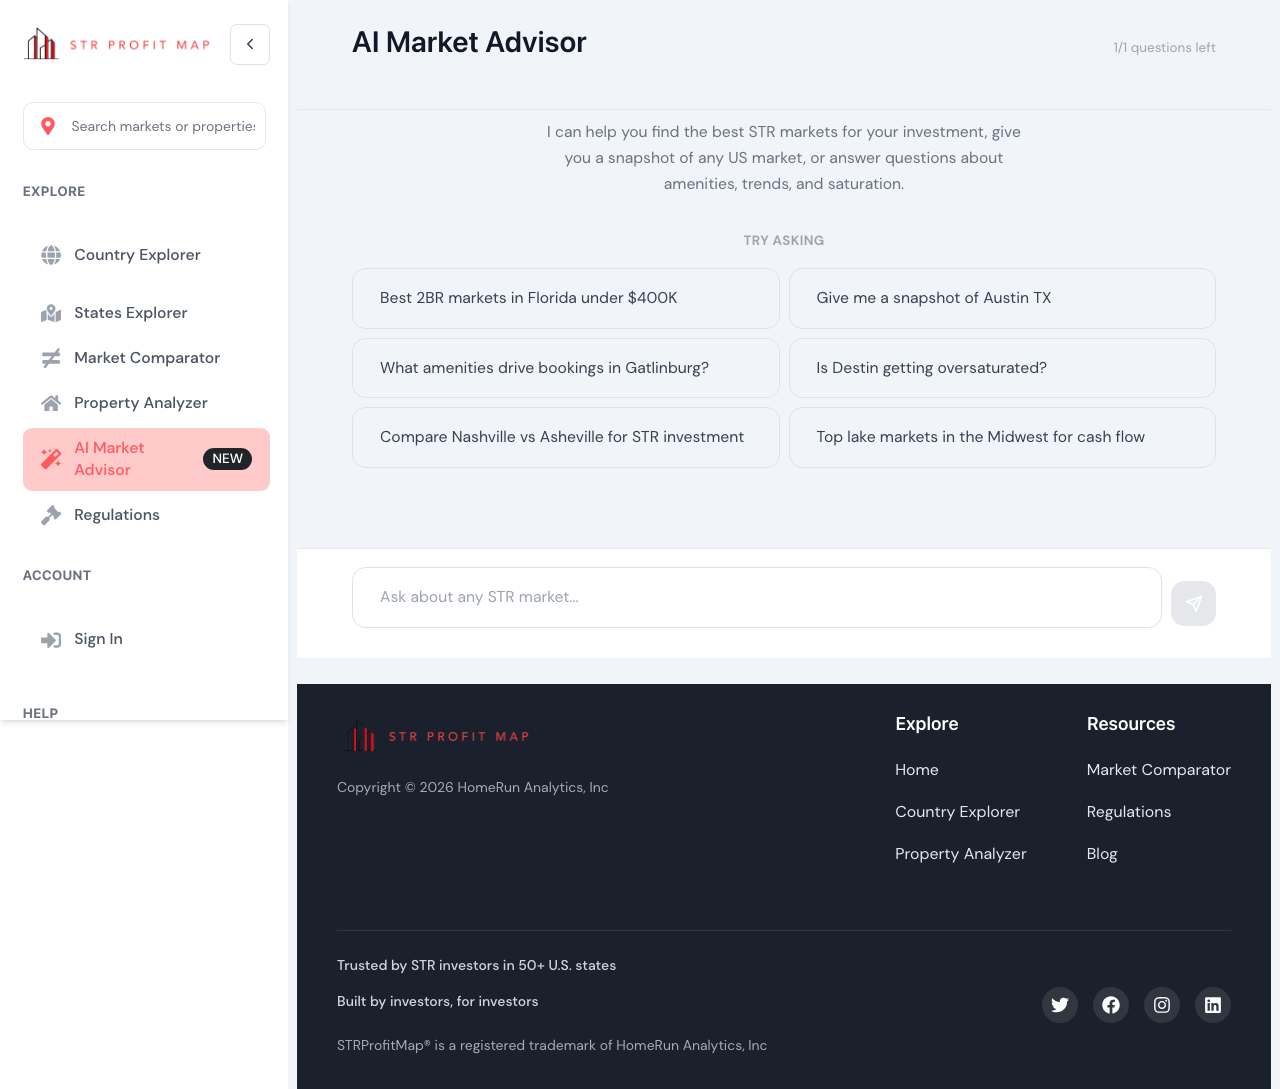
Ask a question. Get an answer backed by real data.
STRProfitMap's AI Advisor answers natural-language questions about any market using live revenue, occupancy, saturation, and regulation data from 5,588 cities.
Type a question like "What are the best mountain markets under $400K that are not oversaturated?" and get ranked results with real numbers: revenue, cap rate, saturation score, regulation grade, and direct links into the full market analysis. The AI Advisor is powered by STRProfitMap's complete dataset, not generic internet knowledge. Every answer includes the data behind it.
- Search for markets by plain-language criteria: location type, price range, performance, regulation status.
- Get market snapshots with revenue, cap rate, home value, saturation, and regulation in one response.
- Compare markets side by side through conversation instead of toggling between pages.
Built for investors who want the answer first and the dashboard second.
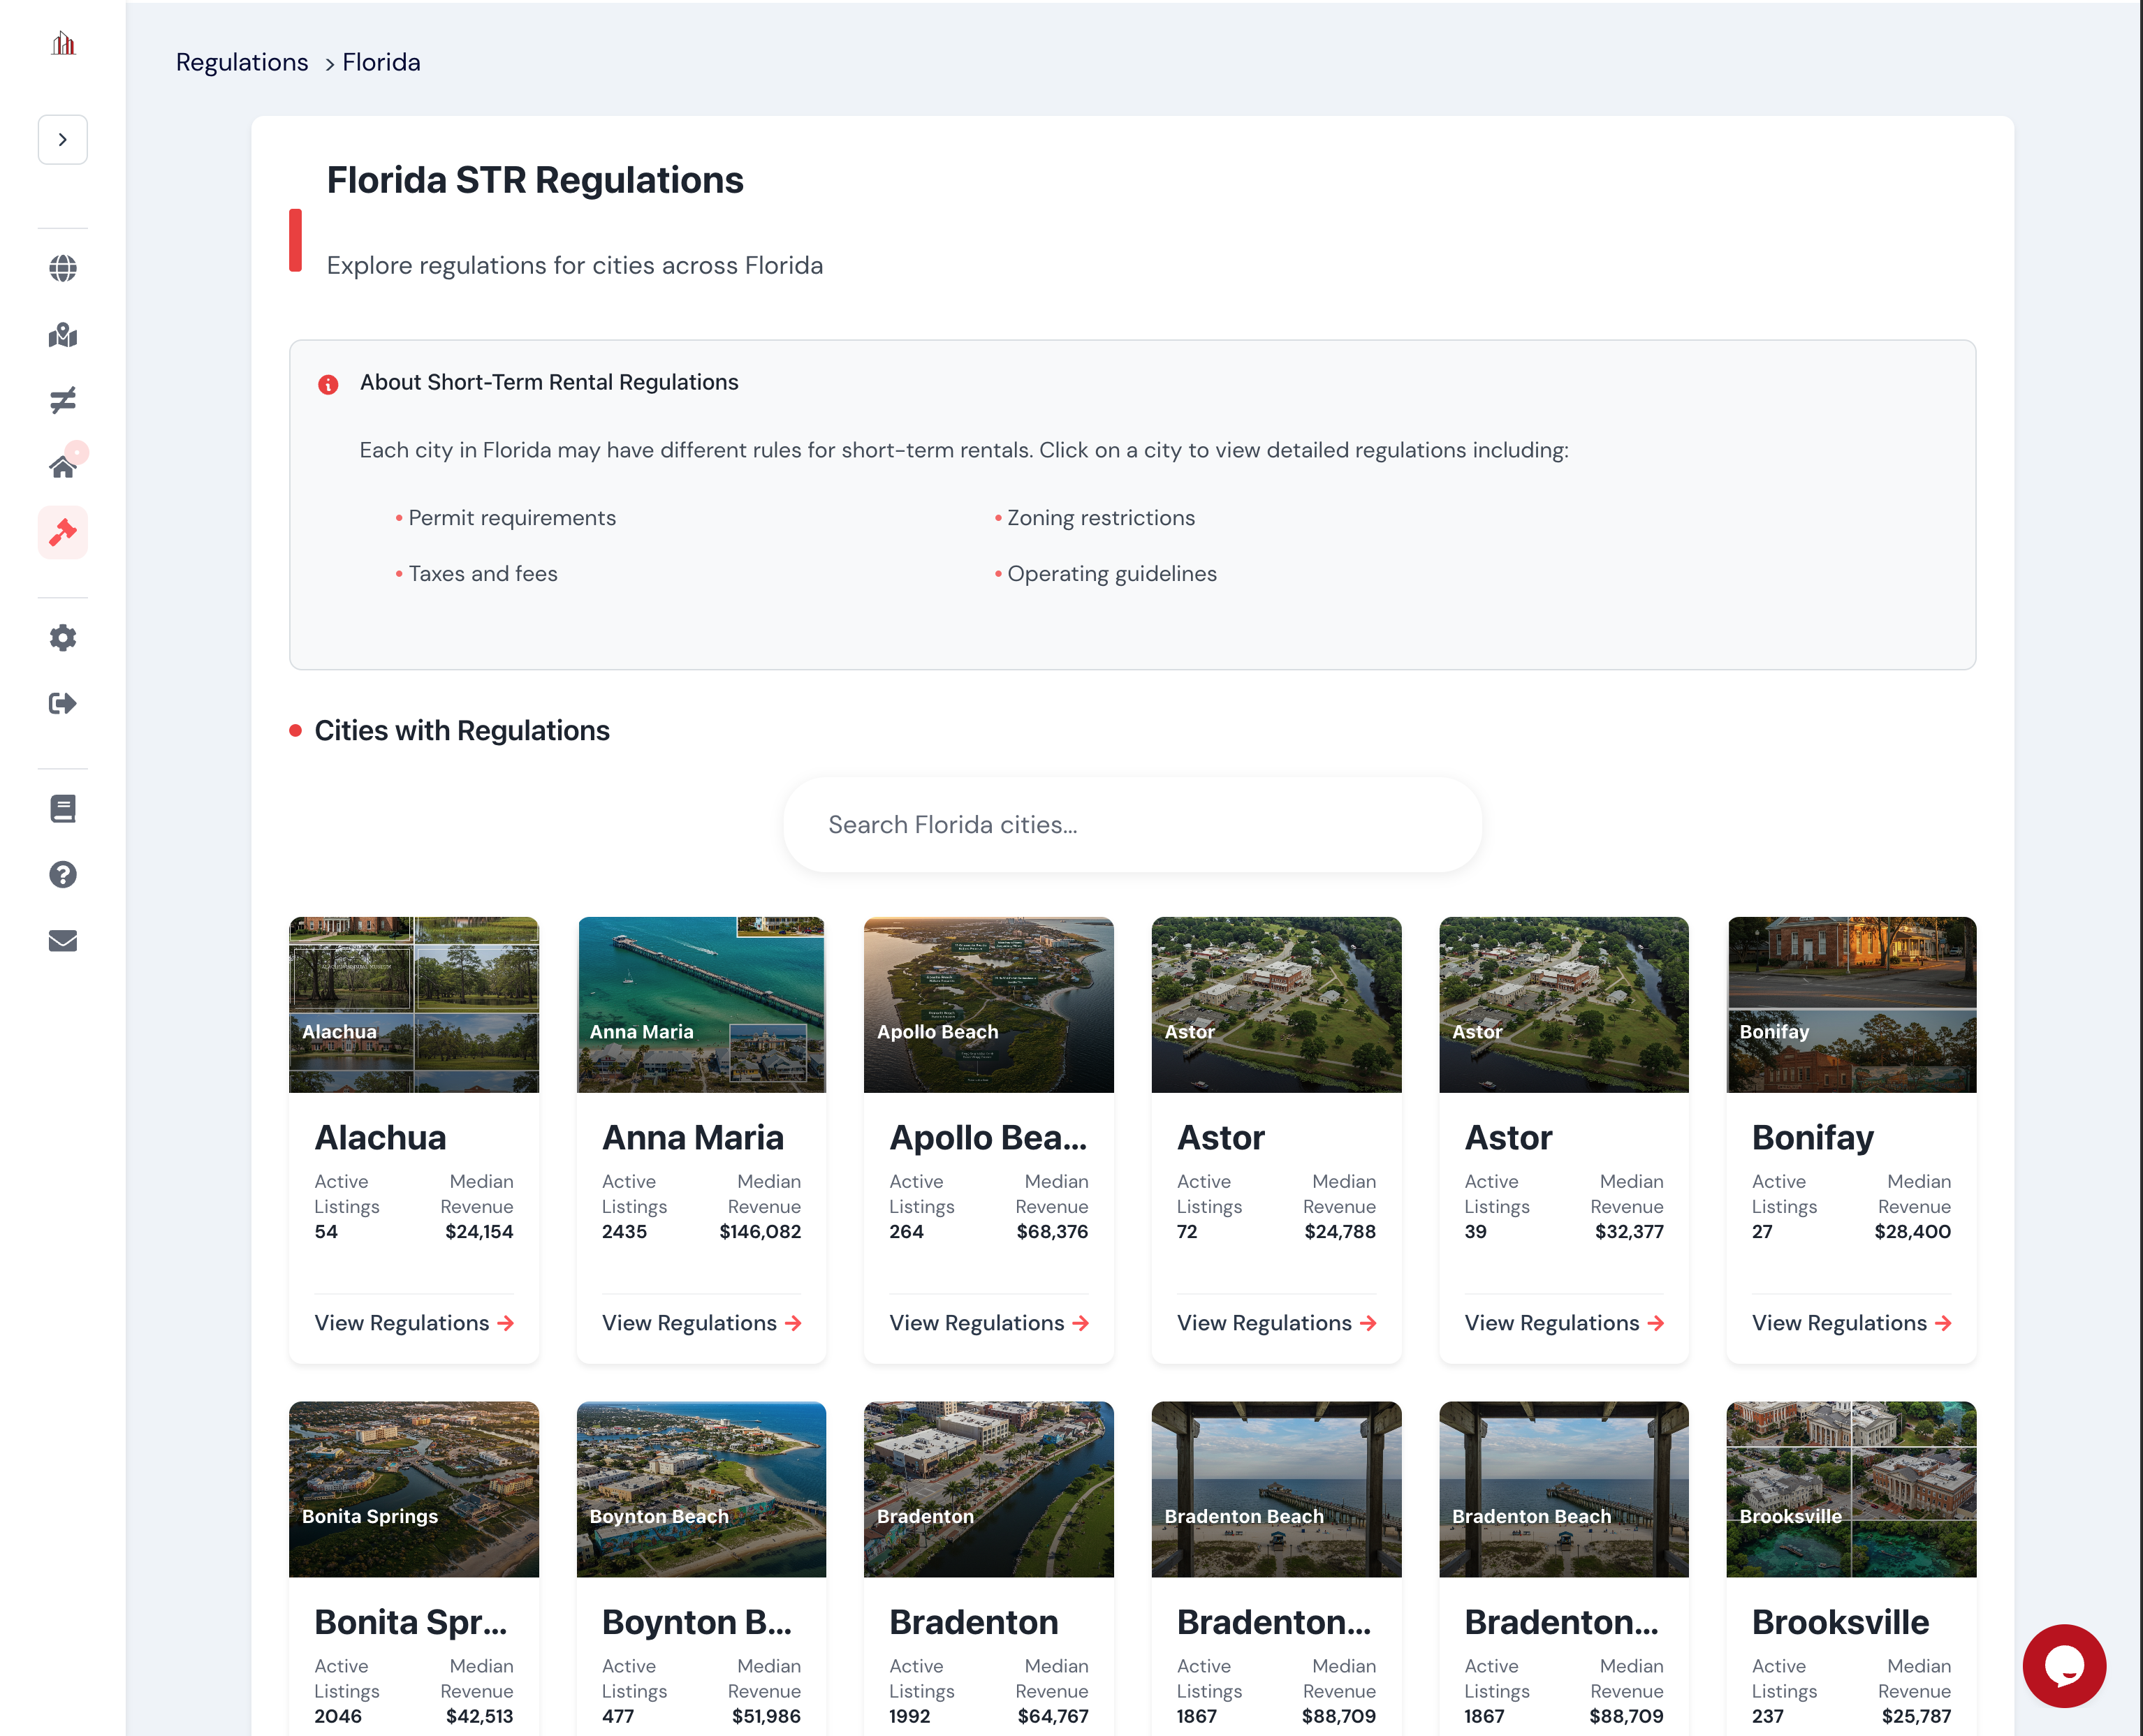
The #1 STR regulations database in the US. More markets covered than any other platform.
Check permit requirements, fees, tax obligations, occupancy limits, and investor-friendliness ratings before you spend a dollar on due diligence.
STRProfitMap maintains the most comprehensive short-term rental regulation database in the country, covering more US markets than AirDNA, Mashvisor, or any competing platform. Every market includes an investor-friendliness rating, permit and licensing requirements, fee schedules, tax obligations, occupancy and operational rules, and a plain-language regulatory summary.
- Get investor-friendliness ratings (color-coded) so you can screen regulatory risk at a glance.
- Read plain-language regulation summaries instead of parsing 40-page municipal PDFs.
- Check regulations alongside revenue and demand data in the same platform, no tab-switching required.
Smart investors check the rules before they check the returns.
Top Short Term Rental Markets
Explore the most profitable short-term rental markets in the US based on cap rate, revenue, market saturation...


Simple Pricing. Serious Value.
Start free, upgrade when you're ready, and run acquisition decisions on a platform designed for serious operators.
Starter
 Coverage across every U.S. state
 Full U.S. Market Analytics (20,000+ markets)
- Excel Export Tools
- Profit maps
- AI Market Advisor
- AI Buy Box
- Regulation Data
- Unlimited property analyzer
Pro Annual
- Coverage across every U.S. state
- Full U.S. Market Analytics (20,000+ markets)
- Excel Export Tools
- Profit Maps
- AI Market Advisor
- AI Buy Box
- Regulation Data
- Unlimited property analyzer
Pro Monthly
- Coverage across every U.S. state
- Full U.S. Market Analytics (20,000+ markets)
- Excel Export Tools
- Profit Maps
- AI Market Advisor
- AI Buy Box
- Regulation Data
- Unlimited property analyzer
Need a custom workflow for your team? Talk with us
Trusted By Investors Making High-Stakes STR Decisions
Real outcomes shared by operators using STRProfitMap to validate markets faster, avoid expensive mistakes, and grow with more confidence.
20,000+ U.S. markets
Coverage depthSecure Stripe billing
Trusted paymentsCancel anytime
No long-term lock-inInvestor-ready insights
Built for acquisitionsFound an overlooked neighborhood that outperformed our baseline.
STRProfitMap showed me an overlooked neighborhood in Austin that now generates 32% higher returns than my previous properties. I used their profit maps to focus my search.

John R.
Property Manager at Shoreline StaysBooking rate jumped after switching into less saturated pockets.
I was stuck in saturated markets until STRProfitMap revealed under-the-radar spots. My booking rate increased by 24% within the first month after relocating.

Marcus L.
Airbnb HostIt's like an AI analyst for investment strategy.
The AI-powered buy box tool saved me countless hours of research. It's my go-to tool before I acquire a property and has transformed my investment approach.

Sophia R.
Portfolio ManagerFound hidden cash-flow opportunities in a market everyone ignored.
In a market everyone said was saturated, STRProfitMap helped me identify micro-neighborhoods with 40% higher ADRs than surrounding areas.

Isami D.
Real Estate InvestorAvoided a costly regulatory mistake before closing.
The regulation data saved me from investing in an area that was about to implement strict STR restrictions. This feature alone paid for itself 100x over.

Lucas M.
Property Portfolio OwnerDecision-making time was cut in half across our deals.
I can now underwrite properties in minutes instead of hours. The export feature lets me quickly run numbers and compare properties side-by-side.

Emile B.
Entrepreneur & STR InvestorClosed faster because everyone reviewed the same data.
Our acquisitions team uses STRProfitMap as the single source of truth before LOI. It reduced back-and-forth and sped up our approvals significantly.

Naomi P.
Director of AcquisitionsStopped guessing and started filtering deals with clear criteria.
The market and regulation views helped us reject weak opportunities early. That discipline improved our pipeline quality almost immediately.
Daniel K.
STR Fund OperatorExpanded to a second market with less uncertainty.
Instead of betting on anecdotal data, we compared markets side by side and validated demand before committing. It changed how we expand.

Rina S.
Co-Host & Portfolio BuilderOur underwriting process is finally consistent.
Before STRProfitMap, every analyst had a different approach. Now we use one framework and make decisions with much less noise.

Trevor M.
Operations Lead, Staywise HomesExpert Insights & Resources
Explore our latest articles to help you make smarter STR investment decisions

Bookings Fell Off a Cliff? First Figure Out If It’s Your Listing or Your Market
Before cutting your Airbnb price again, learn how to diagnose whether bookings are down because of your listing, seasonality, supply growth, or market saturation.
Read article
1.61 Million STR Listings and Counting. How to Tell If Your Market Is Already Oversaturated
Learn how to spot an oversaturated Airbnb market before you buy using supply growth, occupancy, ADR, revenue trends, and reliable comps.
Read article
Is Airbnb Still Profitable in 2026? What 1,065,000 Listings Tell Us
We analyzed 1,065,055 verified Airbnb listings across 3,864 US markets. Here is what the revenue, occupancy, and saturation data actually says about profitability in 2026.
Read article
Best Airbnb Markets to Invest In: 2026 Data-Backed Rankings
Rankings of the best STR investment markets in 2026, based on revenue, occupancy, and ADR data from 1,065,000+ verified Airbnb listings across 3,864 US markets.
Read article
How to Study Top Airbnb Listings (Even If Your Market Doesn't Have Any)
The best amenity ideas don't come from your direct comps. They come from top performers, sometimes in entirely different markets. Here is how to find and study them.
Read article
Must-Have vs. Nice-to-Have Amenities: How to Know the Difference in Any Market
A pool is non-negotiable in Scottsdale but irrelevant in a mountain town. Here is a data-driven method to classify amenities in any STR market, before you waste your budget.
Read articleFrequently Asked Questions
Everything you need to know about our platform
 What exactly do I get access to with a subscription?
 Where does STRProfitMap's data come from, and how often is it updated?What counts as a "reliable listing" and why should I care?How is STRProfitMap different from AirDNA, Mashvisor, or other tools?Does the revenue data include cleaning fees?What do the revenue percentiles (P25, P50, P75, P90) mean?
P25 (Lowest Earners): Bottom 25% of reliable listings by revenue.
P50 (Middle Earners): The median. Half of reliable listings earn more, half earn less.
P75 (Mid-High Earners): Top 25%. These are strong performers with solid operations.
P90 (High Earners): Top 10%. Achievable with a well-located, well-managed property and the right amenities.
You can toggle percentiles at the market level, by bedroom count, or for individual properties. This lets you underwrite conservatively (P50) or see what top operators pull in (P90).
What do cap rate, cash-on-cash return, NOI, and DSCR mean?Cap Rate: Annual net operating income divided by property value. A quick profitability indicator. Higher means better return relative to price.
Cash-on-Cash (CoC): Annual pre-tax cash flow divided by the total cash you invested (down payment, closing costs, rehab). Shows what your actual money earns.
NOI (Net Operating Income): Gross revenue minus operating expenses (cleaning, maintenance, management, supplies, insurance). Does not include mortgage payments.
DSCR (Debt Service Coverage Ratio): NOI divided by annual mortgage payments. A DSCR above 1.0 means the property covers its own debt. Lenders typically want 1.25 or higher.
The Property Analyzer calculates all of these automatically for any address you enter.
Can I try STRProfitMap before subscribing?I can't find my city or neighborhood. Is it covered?Can I export data to use in my own spreadsheets or presentations?How do I analyze a specific property I am considering buying?Can I cancel my subscription at any time?Still have questions?
If your question is not listed here, please reach out to our dedicated support team.
Ask Your Question